ProfitView Strategy TemplateHello traders,
This script took me a full week of coding/testing, sweat, and tears - and I’m too nice as I’m giving it for free to the community.
If you're tired of manual trading and looking for a solid strategy template to pair with your indicators, look no further.
This Pine Script v5 strategy template is engineered for maximum customization and risk management.
Best part?
This Pine Script v5 template facilitates the dynamic construction of ProfitView alerts, sparing users the time and effort of mastering the ProfitView syntax and manually creating alert commands.
This powerful tool gives much power to those who don't know how to code in Pinescript and want to automate their indicators' signals via the ProfitView Chrome extension.
IMPORTANT NOTES
ProfitView is a trading bot software that forwards TradingView alerts to your brokers (examples: Binance, Oanda, Coinbase, Bybit, etc.) for automating trading.
Many traders don't know how to dynamically create ProfitView-compatible alerts using the data from their TradingView scripts.
Traders using trading bots want their alerts to reflect the stop-loss/take-profit/trailing-stop/stop-loss to break options from your script and then create the orders accordingly.
This script showcases how to create ProfitView alerts dynamically.
TRADINGVIEW ALERTS
1) You'll have to create one alert per asset X timeframe = 1 chart.
Example: 1 alert for EUR/USD on the 5 minutes chart, 1 alert for EUR/USD on the 15-minute chart (assuming you want your bot to trade the EUR/USD on the 5 and 15-minute timeframes)
2) Select the Order fills and alert() function calls condition
3) For each alert, the alert message is pre-configured with the text below
{{strategy.order.alert_message}}
Please leave it as it is.
It's a TradingView native variable that will fetch the alert text messages built by the script.
4) ProfitView doesn't use webhook technology, so setting a webhook URL from the alerts notifications tab is unnecessary.
KEY FEATURES
I) Modular Indicator Connection
* plug your existing indicator into the template.
* Only two lines of code are needed for full compatibility.
Step 1: Create your connector
Adapt your indicator with only 2 lines of code and then connect it to this strategy template.
To do so:
1) Find in your indicator where the conditions print the long/buy and short/sell signals.
2) Create an additional plot as below
I'm giving an example with a Two moving averages cross.
Please replicate the same methodology for your indicator, whether a MACD , ZigZag, Pivots , higher-highs, lower-lows or whatever indicator with clear buy and sell conditions.
//@version=5
indicator("Supertrend", overlay = true, timeframe = "", timeframe_gaps = true)
atrPeriod = input.int(10, "ATR Length", minval = 1)
factor = input.float(3.0, "Factor", minval = 0.01, step = 0.01)
= ta.supertrend(factor, atrPeriod)
supertrend := barstate.isfirst ? na : supertrend
bodyMiddle = plot(barstate.isfirst ? na : (open + close) / 2, display = display.none)
upTrend = plot(direction < 0 ? supertrend : na, "Up Trend", color = color.green, style = plot.style_linebr)
downTrend = plot(direction < 0 ? na : supertrend, "Down Trend", color = color.red, style = plot.style_linebr)
fill(bodyMiddle, upTrend, color.new(color.green, 90), fillgaps = false)
fill(bodyMiddle, downTrend, color.new(color.red, 90), fillgaps = false)
buy = ta.crossunder(direction, 0)
sell = ta.crossunder(direction, 0)
//////// CONNECTOR SECTION ////////
Signal = buy ? 1 : sell ? -1 : 0
plot(Signal, title = "Signal", display = display.data_window)
//////// CONNECTOR SECTION ////////
Important Notes
🔥 The Strategy Template expects the value to be exactly 1 for the bullish signal and -1 for the bearish signal
Now, you can connect your indicator to the Strategy Template using the method below or that one.
Step 2: Connect the connector
1) Add your updated indicator to a TradingView chart
2) Add the Strategy Template as well to the SAME chart
3) Open the Strategy Template settings, and in the Data Source field, select your 🔌Connector🔌 (which comes from your indicator)
Note it doesn’t have to be named 🔌Connector🔌 - you can name it as you want - however, I recommend an explicit name you can easily remember.
From then, you should start seeing the signals and plenty of other stuff on your chart.
🔥 Note that whenever you update your indicator values, the strategy statistics and visuals on your chart will update in real-time
II) BOT Risk Management:
- Max Drawdown:
Mode: Select whether the max drawdown is calculated in percentage (%) or USD.
Value: If the max drawdown reaches this specified value, set a value to halt the bot.
- Max Consecutive Days:
Use Max Consecutive Days BOT Halt: Enable/Disable halting the bot if the max consecutive losing days value is reached.
- Max Consecutive Days: Set the maximum number of consecutive losing days allowed before halting the bot.
- Max Losing Streak:
Use Max Losing Streak: Enable/Disable a feature to prevent the bot from taking too many losses in a row.
- Max Losing Streak Length: Set the maximum length of a losing streak allowed.
Margin Call:
- Use Margin Call: Enable/Disable a feature to exit when a specified percentage away from a margin call to prevent it.
Margin Call (%): Set the percentage value to trigger this feature.
- Close BOT Total Loss:
Use Close BOT Total Loss: Enable/Disable a feature to close all trades and halt the bot if the total loss is reached.
- Total Loss ($): Set the total loss value in USD to trigger this feature.
Intraday BOT Risk Management:
- Intraday Losses:
Use Intraday Losses BOT Halt: Enable/Disable halting the bot on reaching specified intraday losses.
Mode: Select whether the intraday loss is calculated in percentage (%) or USD.
- Max Intraday Losses (%): Set the value for maximum intraday losses.
Limit Intraday Trades:
- Use Limit Intraday Trades: Enable/Disable a feature to limit the number of intraday trades.
- Max Intraday Trades: Set the maximum number of intraday trades allowed.
Restart Intraday EA:
- Use Restart Intraday EA: Enable/Disable a feature to restart the bot at the first bar of the next day if it has been stopped with an intraday risk management safeguard.
III) Order Types and Position Sizing
- Choose between market, limit, or stop orders.
- Set your position size directly in the template.
Please use the position size from the “Inputs” and not the “Properties” tab.
I know it's redundant. - the template needs this value from the "Inputs" tab to build the alerts, and the Backtester needs it from the "Properties" tab.
IV) Advanced Take-Profit and Stop-Loss Options
- Choose to set your SL/TP in either pips or percentages.
- Option for multiple take-profit levels and trailing stop losses.
- Move your stop loss to break even +/- offset in pips for “risk-free” trades.
V) Miscellaneous
Retry order openings if they fail.
Order Types:
Select and specify order type and price settings.
Position Size:
Define the type and size of positions.
Leverage:
Leverage settings, including margin type and hedge mode.
Session:
Limit trades to specific sessions.
Dates:
Limit trades to a specific date range.
Trades Direction:
Direction: Specify the market direction for opening positions.
VI) Notifications (Telegram/Discord/Email/IFTTT/Twilio/SMS)
Customize notifications sent to Telegram, Discord, Email, IFTTT, Twilio, and ProfitView Logger.
VII) Logger
The ProfitView commands are logged in the TradingView logger.
You'll find more information about it in this TradingView blog post .
WHY YOU MIGHT NEED THIS TEMPLATE
1) Transform your indicator into a ProfitView trading bot more easily than before
Connect your indicator to the template
Create your alerts
Set your EA settings
2) Save Time
Auto-generated alert messages for ProfitView.
I tested them all and checked with the support team what could/couldn’t be done.
3) Be in Control
Manage your trading risks with advanced features.
4) Customizable
Fits various trading styles and asset classes.
REQUIREMENTS
* Make sure you have your ProfitView account and do the settings correctly in your Chrome extension. If you don't know how to do it, read the documentation + ask for help in the ProfitView Discord support channel.
* If there is any issue with the template, ask me in the comments section - I’ll answer quickly.
BACKTEST RESULTS FROM THIS POST
1) I connected this strategy template to a dummy Supertrend script.
I could have selected any other indicator or concept for this script post.
I wanted to share an example of how you can quickly upgrade your strategy, making it compatible with ProfitView.
2) The backtest results aren't relevant for this educational script publication.
I used realistic backtesting data but didn't look too much into optimizing the results, as this isn't the point of why I'm publishing this script.
This strategy is a template to be connected to any indicator - the sky is the limit. :)
3) This template is made to take 1 trade per direction at any given time.
Pyramiding is set to 1 on TradingView.
The strategy default settings are:
* Initial Capital: 100000 USD
* Position Size: 1%
* Commission Percent: 0.075%
* Slippage: 1 tick
* No margin/leverage used
Best regards,
Dave
ابحث في النصوص البرمجية عن "the strat"

Pineconnector Strategy Template (Connect Any Indicator)Hello traders,
If you're tired of manual trading and looking for a solid strategy template to pair with your indicators, look no further.
This Pine Script v5 strategy template is engineered for maximum customization and risk management.
Best part?
It’s optimized for Pineconnector, allowing seamless integration with MetaTrader 4 and 5.
This powerful tool gives a lot of power to those who don't know how to code in Pinescript and are looking to automate their indicators' signals on Metatrader 4/5.
IMPORTANT NOTES
Pineconnector is a trading bot software that forwards TradingView alerts to your Metatrader 4/5 for automating trading.
Many traders don't know how to dynamically create Pineconnector-compatible alerts using the data from their TradingView scripts.
Traders using trading bots want their alerts to reflect the stop-loss/take-profit/trailing-stop/stop-loss to break options from your script and then create the orders accordingly.
This script showcases how to create Pineconnector alerts dynamically.
Pineconnector doesn't support alerts with multiple Take Profits.
As a workaround, for 2 TPs, I had to open two trades.
It's not optimal, as we end up paying more spreads for that extra trade - however, depending on your trading strategy, it may not be a big deal.
TRADINGVIEW ALERTS
1) You'll have to create one alert per asset X timeframe = 1 chart.
Example: 1 alert for EUR/USD on the 5 minutes chart, 1 alert for EUR/USD on the 15-minute chart (assuming you want your bot to trade the EUR/USD on the 5 and 15-minute timeframes)
2) Select the Order fills and alert() function calls condition
3) For each alert, the alert message is pre-configured with the text below
{{strategy.order.alert_message}}
Please leave it as it is.
It's a TradingView native variable that will fetch the alert text messages built by the script.
4) Don't forget to set the Pineconnector webhook URL in the Notifications tab of the TradingView alerts UI.
You’ll find the URL on the Pineconnector documentation website.
EA CONFIGURATION
1) The Pyramiding in the EA on Metatrader must be set to 2 if you want to trade with 2 TPs => as it's opening 2 trades.
If you only want 1 TP, set the EA Pyramiding to 1.
Regarding the other EA settings, please refer to the Pineconnector documentation on their website.
2) In the EA, you can set a risk (= position size type) in %/lots/USD, as in the TradingView backtest settings.
KEY FEATURES
I) Modular Indicator Connection
* plug in your existing indicator into the template.
* Only two lines of code are needed for full compatibility.
Step 1: Create your connector
Adapt your indicator with only 2 lines of code and then connect it to this strategy template.
To do so:
1) Find in your indicator where the conditions print the long/buy and short/sell signals.
2) Create an additional plot as below
I'm giving an example with a Two moving averages cross.
Please replicate the same methodology for your indicator, whether it's a MACD , ZigZag , Pivots , higher-highs, lower-lows, or whatever indicator with clear buy and sell conditions.
//@version=5
indicator("Supertrend", overlay = true, timeframe = "", timeframe_gaps = true)
atrPeriod = input.int(10, "ATR Length", minval = 1)
factor = input.float(3.0, "Factor", minval = 0.01, step = 0.01)
= ta.supertrend(factor, atrPeriod)
supertrend := barstate.isfirst ? na : supertrend
bodyMiddle = plot(barstate.isfirst ? na : (open + close) / 2, display = display.none)
upTrend = plot(direction < 0 ? supertrend : na, "Up Trend", color = color.green, style = plot.style_linebr)
downTrend = plot(direction < 0 ? na : supertrend, "Down Trend", color = color.red, style = plot.style_linebr)
fill(bodyMiddle, upTrend, color.new(color.green, 90), fillgaps = false)
fill(bodyMiddle, downTrend, color.new(color.red, 90), fillgaps = false)
buy = ta.crossunder(direction, 0)
sell = ta.crossunder(direction, 0)
//////// CONNECTOR SECTION ////////
Signal = buy ? 1 : sell ? -1 : 0
plot(Signal, title = "Signal", display = display.data_window)
//////// CONNECTOR SECTION ////////
Important Notes
🔥 The Strategy Template expects the value to be exactly 1 for the bullish signal and -1 for the bearish signal
Now, you can connect your indicator to the Strategy Template using the method below or that one.
Step 2: Connect the connector
1) Add your updated indicator to a TradingView chart
2) Add the Strategy Template as well to the SAME chart
3) Open the Strategy Template settings, and in the Data Source field, select your 🔌Connector🔌 (which comes from your indicator)
Note it doesn’t have to be named 🔌Connector🔌 - you can name it as you want - however, I recommend an explicit name you can easily remember.
From then, you should start seeing the signals and plenty of other stuff on your chart.
🔥 Note that whenever you update your indicator values, the strategy statistics and visuals on your chart will update in real-time
II) Customizable Risk Management
- Choose between percentage or USD modes for maximum drawdown.
- Set max consecutive losing days and max losing streak length.
- I used the code from my friend @JosKodify for the maximum losing streak. :)
Will halt the EA and backtest orders fill whenever either of the safeguards above are “broken”
III) Intraday Risk Management
- Limit the maximum intraday losses both in percentage or USD.
- Option to set a maximum number of intraday trades.
- If your EA gets halted on an intraday chart, auto-restart it the next day.
IV) Spread and Account Filters
- Trade only if the spread is below a certain pip value.
- Set requirements based on account balance or equity.
V) Order Types and Position Sizing
- Choose between market, limit, or stop orders.
- Set your position size directly in the template.
Please use the position size from the “Inputs” and not the “Properties” tab.
Reason : The template sends the order on the same candle as the entry signals - at those entry signals candles, the position size isn’t computed yet, and the template can’t then send it to Pineconnector.
However, you can use the position size type (USD, contracts, %) from the “Properties” tab for backtesting.
In the EA, you can define the position size type for your orders in USD or lots or %.
VI) Advanced Take-Profit and Stop-Loss Options
- Choose to set your SL/TP in either pips or percentages.
- Option for multiple take-profit levels and trailing stop losses.
- Move your stop loss to break even +/- offset in pips for “risk-free” trades.
VII) Logger
The Pineconnector commands are logged in the TradingView logger.
You'll find more information about it in this TradingView blog post .
WHY YOU MIGHT NEED THIS TEMPLATE
1) Transform your indicator into a Pineconnector trading bot more easily than before
Connect your indicator to the template
Create your alerts
Set your EA settings
2) Save Time
Auto-generated alert messages for Pineconnector.
I tested them all, and I checked with the support team what could/can’t be done
3) Be in Control
Manage your trading risks with advanced features.
4) Customizable
Fits various trading styles and asset classes.
REQUIREMENTS
* Make sure you have your Pineconnector license ID.
* Create your alerts with the Pineconnector webhook URL
* If there is any issue with the template, ask me in the comments section - I’ll answer quickly.
BACKTEST RESULTS FROM THIS POST
1) I connected this strategy template to a dummy Supertrend script.
I could have selected any other indicator or concept for this script post.
I wanted to share an example of how you can quickly upgrade your strategy, making it compatible with Pineconnector.
2) The backtest results aren't relevant for this educational script publication.
I used realistic backtesting data but didn't look too much into optimizing the results, as this isn't the point of why I'm publishing this script.
This strategy is a template to be connected to any indicator - the sky is the limit. :)
3) This template is made to take 1 trade per direction at any given time.
Pyramiding is set to 1 on TradingView.
The strategy default settings are:
* Initial Capital: 100000 USD
* Position Size: 1 contract
* Commission Percent: 0.075%
* Slippage: 1 tick
* No margin/leverage used
WHAT’S COMING NEXT FOR YOU GUYS?
I’ll make the same template for ProfitView, then for AutoView, and then for Alertatron.
All of those are free and open-source.
I have no affiliations with any of those companies - I'm publishing those templates as they will be useful to many of you.
Dave

Heatmap MACD Strategy - Pineconnector (Dynamic Alerts)Hello traders
This script is an upgrade of this template script.
Heatmap MACD Strategy
Pineconnector
Pineconnector is a trading bot software that forwards TradingView alerts to your Metatrader 4/5 for automating trading.
Many traders don't know how to dynamically create Pineconnector-compatible alerts using the data from their TradingView scripts.
Traders using trading bots want their alerts to reflect the stop-loss/take-profit/trailing-stop/stop-loss to breakeven options from your script and then create the orders accordingly.
This script showcases how to create Pineconnector alerts dynamically.
Pineconnector doesn't support alerts with multiple Take Profits.
As a workaround, for 2 TPs, I had to open two trades.
It's not optimal, as we end up paying more spreads for that extra trade - however, depending on your trading strategy, it may not be a big deal.
TradingView Alerts
1) You'll have to create one alert per asset X timeframe = 1 chart.
Example : 1 alert for EUR/USD on the 5 minutes chart, 1 alert for EUR/USD on the 15-minute chart (assuming you want your bot to trade the EUR/USD on the 5 and 15-minute timeframes)
2) For each alert, the alert message is pre-configured with the text below
{{strategy.order.alert_message}}
Please leave it as it is.
It's a TradingView native variable that will fetch the alert text messages built by the script.
3) Don't forget to set the webhook URL in the Notifications tab of the TradingView alerts UI.
EA configuration
The Pyramiding in the EA on Metatrader must be set to 2 if you want to trade with 2 TPs => as it's opening 2 trades.
If you only want 1 TP, set the EA Pyramiding to 1.
Regarding the other EA settings, please refer to the Pineconnector documentation on their website.
Logger
The Pineconnector commands are logged in the TradingView logger.
You'll find more information about it from this TradingView blog post
Important Notes
1) This multiple MACDs strategy doesn't matter much.
I could have selected any other indicator or concept for this script post.
I wanted to share an example of how you can quickly upgrade your strategy, making it compatible with Pineconnector.
2) The backtest results aren't relevant for this educational script publication.
I used realistic backtesting data but didn't look too much into optimizing the results, as this isn't the point of why I'm publishing this script.
3) This template is made to take 1 trade per direction at any given time.
Pyramiding is set to 1 on TradingView.
The strategy default settings are:
Initial Capital: 100000 USD
Position Size: 1 contract
Commission Percent: 0.075%
Slippage: 1 tick
No margin/leverage used
For example, those are realistic settings for trading CFD indices with low timeframes but not the best possible settings for all assets/timeframes.
Concept
The Heatmap MACD Strategy allows selecting one MACD in five different timeframes.
You'll get an exit signal whenever one of the 5 MACDs changes direction.
Then, the strategy re-enters whenever all the MACDs are in the same direction again.
It takes:
long trades when all the 5 MACD histograms are bullish
short trades when all the 5 MACD histograms are bearish
You can select the same timeframe multiple times if you don't need five timeframes.
For example, if you only need the 30min, the 1H, and 2H, you can set your timeframes as follow:
30m
30m
30m
1H
2H
Risk Management Features
All the features below are pips-based.
Stop-Loss
Trailing Stop-Loss
Stop-Loss to Breakeven after a certain amount of pips has been reached
Take Profit 1st level and closing X% of the trade
Take Profit 2nd level and close the remaining of the trade
Custom Exit
I added the option ON/OFF to close the opened trade whenever one of the MACD diverges with the others.
Help me help the community
If you see any issue when adding your strategy logic to that template regarding the orders fills on your Metatrader, please let me know in the comments.
I'll use your feedback to make this template more robust. :)
What's next?
I'll publish a more generic template built as a connector so you can connect any indicator to that Pineconnector template.
Then, I'll publish a template for Capitalise AI, ProfitView, AutoView, and Alertatron.
Thank you
Dave

AI SuperTrend - Strategy [presentTrading]
█ Introduction and How it is Different
The AI Supertrend Strategy is a unique hybrid approach that employs both traditional technical indicators and machine learning techniques. Unlike standard strategies that rely solely on traditional indicators or mathematical models, this strategy integrates the power of k-Nearest Neighbors (KNN), a machine learning algorithm, with the tried-and-true SuperTrend indicator. This blend aims to provide traders with more accurate, responsive, and context-aware trading signals.
*The KNN part is mainly referred from @Zeiierman.
BTCUSD 8hr performance
ETHUSD 8hr performance
█ Strategy, How it Works: Detailed Explanation
SuperTrend Calculation
Volume-Weighted Moving Average (VWMA): A VWMA of the close price is calculated based on the user-defined length (len). This serves as the central line around which the upper and lower bands are calculated.
Average True Range (ATR): ATR is calculated over a period defined by len. It measures the market's volatility.
Upper and Lower Bands: The upper band is calculated as VWMA + (factor * ATR) and the lower band as VWMA - (factor * ATR). The factor is a user-defined multiplier that decides how wide the bands should be.
KNN Algorithm
Data Collection: An array (data) is populated with recent n SuperTrend values. Corresponding labels (labels) are determined by whether the weighted moving average price (price) is greater than the weighted moving average of the SuperTrend (sT).
Distance Calculation: The absolute distance between each data point and the current SuperTrend value is calculated.
Sorting & Weighting: The distances are sorted in ascending order, and the closest k points are selected. Each point is weighted by the inverse of its distance to the current point.
Classification: A weighted sum of the labels of the k closest points is calculated. If the sum is closer to 1, the trend is predicted as bullish; if closer to 0, bearish.
Signal Generation
Start of Trend: A new bullish trend (Start_TrendUp) is considered to have started if the current trend color is bullish and the previous was not bullish. Similarly for bearish trends (Start_TrendDn).
Trend Continuation: A bullish trend (TrendUp) is considered to be continuing if the direction is negative and the KNN prediction is 1. Similarly for bearish trends (TrendDn).
Trading Logic
Long Condition: If Start_TrendUp or TrendUp is true, a long position is entered.
Short Condition: If Start_TrendDn or TrendDn is true, a short position is entered.
Exit Condition: Dynamic trailing stops are used for exits. If the trend does not continue as indicated by the KNN prediction and SuperTrend direction, an exit signal is generated.
The synergy between SuperTrend and KNN aims to filter out noise and produce more reliable trading signals. While SuperTrend provides a broad sense of the market direction, KNN refines this by predicting short-term price movements, leading to a more nuanced trading strategy.
Local picture
█ Trade Direction
The strategy allows traders to choose between taking only long positions, only short positions, or both. This is particularly useful for adapting to different market conditions.
█ Usage
ToolTips: Explains what each parameter does and how to adjust them.
Inputs: Customize values like the number of neighbors in KNN, ATR multiplier, and moving average type.
Plotting: Visual cues on the chart to indicate bullish or bearish trends.
Order Execution: Based on the generated signals, the strategy will execute buy/sell orders.
█ Default Settings
The default settings are selected to provide a balanced approach, but they can be modified for different trading styles and asset classes.
Initial Capital: $10,000
Default Quantity Type: 10% of equity
Commission: 0.1%
Slippage: 1
Currency: USD
By combining both machine learning and traditional technical analysis, this strategy offers a sophisticated and adaptive trading solution.

Risk Management and Positionsize - MACD exampleMastering Risk Management
Risk management is the cornerstone of successful trading, and it's often the difference between turning a profit and suffering a loss. In light of its importance, I share a risk management tool which you can use for your trading strategies. The script not only assists in position sizing but also comes with built-in technical features that help in market timing. Let's delve into the nitty-gritty details.
Input Parameter: MarginFactor
One of the key features of the script is the MarginFactor input parameter. This element lets you control the portion of your equity used for placing each trade. A MarginFactor of -0.5 means 50% of your total equity will be deployed in placing the position size. Although Tradingview has a built-in option to adjust position sizing in a same way, I personally prefer to have the logic in my pinecode script. The main reason is userexperience in managing and testing different settings for different charts, timeframes and instruments (with the same strategy).
Stoploss and MarginFactor
If your strategy has a 4% stop-loss, you can choose to use only 50% of your equity by setting the MarginFactor to -0.5. In this case, you are effectively risking only 2% of your total capital per trade, which aligns well with the widely-accepted rule of thumb suggesting a 1-2% risk per trade. Similar if your stoploss is only 1% you can choose to change the MarginFactor to 1, resulting in a positionsize of 200% of your equity. The total risk would be again 2% per trade if your stoploss is set to 1%.
Max Drawdown and MarginFactor
Your MarginFactor setting can also be aligned with the maximum drawdown of your strategy, seen during a backtested period of 2-3 years. For example, if the max drawdown is 15%, you could calibrate your MarginFactor accordingly to limit your risk exposure.
Option to Toggle Number of Contracts
The script offers the option to toggle between using a percentage of equity for position sizing or specifying a fixed number of contracts. Utilizing a percentage of equity might yield unrealistic backtest results, especially over longer periods. This occurs because as the capital grows, the absolute position size also increases, potentially inflating the accumulated returns generated by the backtester. On the other hand, setting a fixed number of contracts as your position size offers a more stable and realistic ROI over the backtested period, as it removes the compounding effect on position sizes.
Key Features Strategy
MACD High Time Frame Entry and Exit Logic
The strategy employs a high time frame MACD (Moving Average Convergence Divergence) to make entry and exit decisions. You can easily adjust the timeframe settings and MACD settings in the inputsection to trade on lower timeframes. For more information on the HTF MACD with dynamic smoothing see:
Moving Average High Time Frame Filter
To reduce market 'noise', the strategy incorporates a high time frame moving average filter. This ensures that the trades are aligned with the dominant market trend (trading the trend). In the inputsection traders can easily switch between different type of moving averages. For more information about this HTF filter see:
Dynamic Smoothing
The script includes a feature for dynamic smoothing. The script contains The timeframeToMinutes(tf) function to convert any given time frame into its equivalent in minutes. For example, a daily (D) time frame is converted into 1440 minutes, a weekly (W) into 10,080 minutes, and so forth. Next the smoothing factor is calculated by dividing the minutes of the higher time frame by those of the current time frame. Finally, the script applies a Simple Moving Average (SMA) over the MACD, SIGNAL, and HIST values, MA filter using the dynamically calculated smoothing factor.
User Convenience: One of the major benefits is that traders don't need to manually adjust the smoothing factor when switching between different time frames. The script does this dynamically.
Visual Consistency: Dynamic smoothing helps traders to more accurately visualize and interpret HTF indicators when trading on lower time frames.
Time Frame Restriction: It's crucial to note that the operational time frame should always be lower than the time frame selected in the input sections for dynamic smoothing to function as intended.
By incorporating this dynamic smoothing logic, the script offers traders a nuanced yet straightforward way to adapt High Time Frame indicators for lower time frame trading, enhancing both adaptability and user experience.
Limitations: Exit Strategy
It's crucial to note that the script comes with a simplified exit strategy, devoid of features like a stop-loss, trailing stop-loss or multiple take profits. This means that while the script focuses on entries and risk management, it might result in higher losses if market conditions unexpectedly turn unfavorable.
Conclusion
Effective risk management is pivotal for trading success, and this TradingView script is designed to give you a better idea how to implement positions sizing with your preferred strategy. However, it's essential to note that this tool should not be considered financial advice. Always perform your due diligence and consult with financial advisors before making any trading decisions.
Feel free to use this risk management tool as building block in your trading scripts, Happy Trading!

Pivot Point SuperTrend Strategy +TrendFilterIn the dynamic world of financial markets, traders are always on the lookout for innovative strategies to identify trends and make timely trades. The "Pivot Point SuperTrend strategy +TrendFilter" has emerged as an intriguing approach, combining two popular indicators - Pivot Points and SuperTrend, while introducing an additional trend filter for added precision. This strategy draws inspiration from Lonesome TheBlue's "Pivot Point SuperTrend" script, aiming to provide traders with a reliable tool for trend following while minimizing false signals.
The Core Concept:
The strategy's foundation lies in the fusion of Pivot Points and SuperTrend indicators, and the addition of a robust trend filter. It begins by calculating Pivot Highs and Lows over a specified period, serving as crucial reference points for trend analysis. Through a weighted average calculation, these Pivot Points create a center line, refining the overall indicator.
Next, based on the center line and the Average True Range (ATR) with a user-defined Factor, upper and lower bands are generated. These bands adapt to market volatility, adding flexibility to the strategy. The heart of the "Pivot Point SuperTrend" strategy lies in accurately identifying the prevailing trend, with the indicator smoothly transitioning between bullish and bearish signals as the price interacts with the SuperTrend bands.
The additional trend filter introduced into the strategy further enhances its capabilities. This filter is based on a moving average, providing a dynamic assessment of the trend's strength and direction. By combining this trend filter with the original Pivot Point SuperTrend signals, the strategy aims to make more informed and reliable trading decisions.
Advantages of "Pivot Point SuperTrend" with Trend Filter:
1. Enhanced Precision: The incorporation of a trend filter improves the strategy's accuracy by confirming the overall trend direction before generating signals.
2. Trend Continuation: The integration of Pivot Points and SuperTrend, along with the trend filter, aims to prolong trades during strong market trends, potentially maximizing profit opportunities.
3. Reduced Whipsaws: The strategy's weighted average calculation, coupled with the trend filter, helps minimize false signals and reduces whipsaws during uncertain or sideways market conditions.
4. Support and Resistance Insights: The strategy continues to provide additional support and resistance levels based on the Pivot Points, offering valuable contextual information to traders.

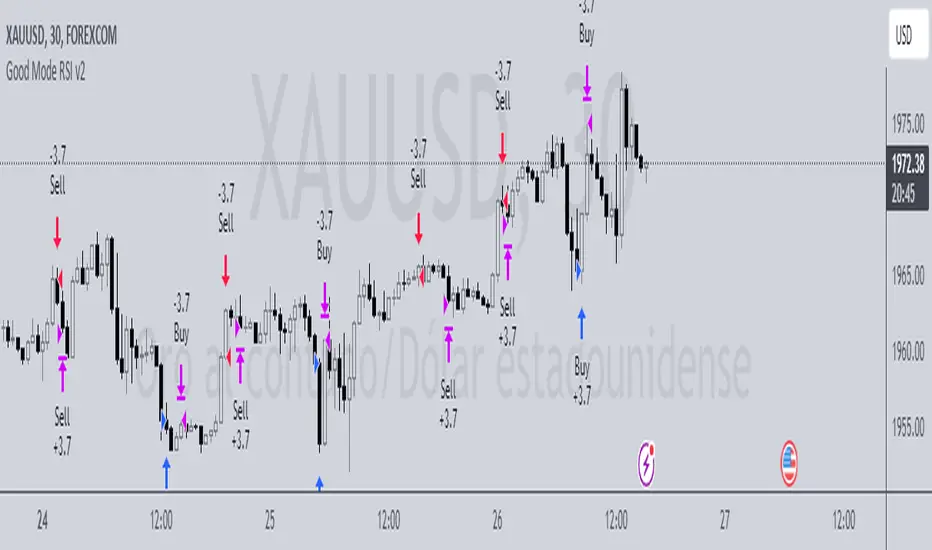
Good Mode RSI v2► Description:
"Good Mode RSI v2" is a powerful trading strategy designed to provide informed trading decisions. This script utilizes the popular RSI (Relative Strength Index) indicator to identify potential buying and selling opportunities in the market. It goes beyond the traditional use of RSI by incorporating carefully selected parameters to enhance its effectiveness. The strategy stands out for its customized combination of RSI levels and stop-loss/take-profit thresholds, allowing for precise trade entries and exits while effectively managing risk.
► How to Use:
To utilize the "Good Mode RSI v2" strategy, follow these steps:
1. Apply the script to your desired trading instrument and timeframe in TradingView.
2. Monitor the chart for trade signals generated by the strategy.
3. When the RSI reaches the sell level of 96, a sell signal is generated. Consider placing a sell order to take advantage of potential downward price movements.
4. take-profit level at 60 to secure profits in a strong downtrend.
5. When the RSI drops below the buy level of 4, a buy signal is generated. Consider placing a buy order to enter the market at a favorable price.
6. take-profit level at 30 to secure profits in a strong uptrend.
7. Monitor the RSI indicator on the chart to stay updated on its current value and anticipate potential trade signals.
Please note that trading decisions should be made based on a comprehensive analysis of multiple factors, including market conditions, trend analysis, and risk management. The "Good Mode RSI v2" strategy can serve as a valuable tool in your trading journey, but it should be used in conjunction with your own research and analysis.
► About it:
The "Good Mode RSI v2" strategy is not a mere replication or slight modification of existing strategies or indicators. It has been carefully crafted to provide traders with an original and purposeful approach to trading using the RSI indicator. The strategy's unique configuration of RSI levels and stop-loss/take-profit thresholds allows for improved performance and profitability. Backtesting results have shown impressive metrics, including a gain factor of 2.445 and a compelling profitability of 78.07% during the testing period.
► Referrals:
If you have any questions or need further assistance with the "Good Mode RSI v2" strategy, feel free to ask. Good luck with your trading endeavors!
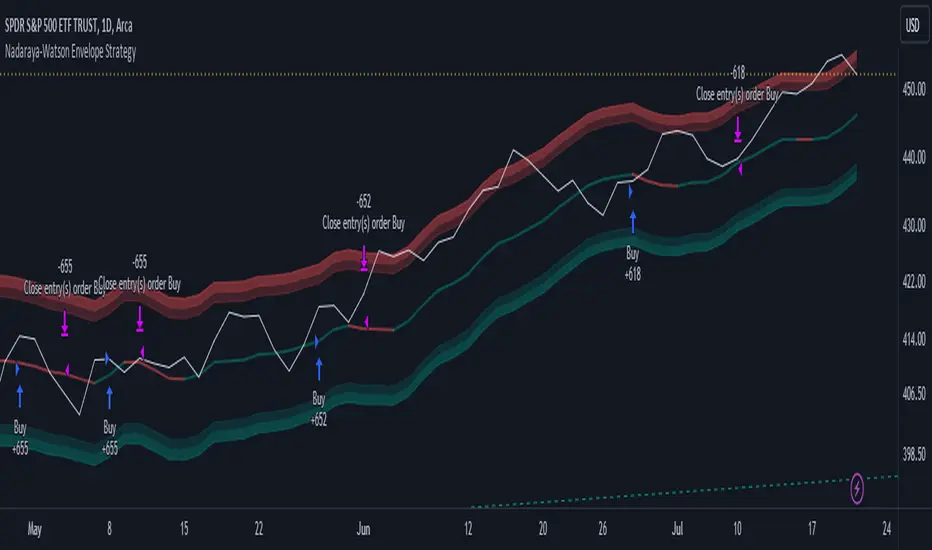
Nadaraya-Watson Envelope Strategy (Non-Repainting) Log ScaleIn the diverse world of trading strategies, the Nadaraya-Watson Envelope Strategy offers a different approach. Grounded in mathematical analysis, this strategy utilizes the Nadaraya-Watson kernel regression, a method traditionally employed for interpreting complex data patterns.
At the core of this strategy lies the concept of 'envelopes', which are essentially dynamic volatility bands formed around the price based on a custom Average True Range (ATR). These envelopes help provide guidance on potential market entry and exit points. The strategy suggests considering a buy when the price crosses the lower envelope and a sell when it crosses the upper envelope.
One distinctive characteristic of the Nadaraya-Watson Envelope Strategy is its use of a logarithmic scale, as opposed to a linear scale. The logarithmic scale can be advantageous when dealing with larger timeframes and assets with wide-ranging price movements.
The strategy is implemented using Pine Script v5, and includes several adjustable parameters such as the lookback window, relative weighting, and the regression start point, providing a level of flexibility.
However, it's important to maintain a balanced view. While the use of mathematical models like the Nadaraya-Watson kernel regression may provide insightful data analysis, no strategy can guarantee success. Thorough backtesting, understanding the mathematical principles involved, and sound risk management are always essential when applying any trading strategy.
The Nadaraya-Watson Envelope Strategy thus offers another tool for traders to consider. As with all strategies, its effectiveness will largely depend on the trader's understanding, application, and the specific market conditions.
Buy&Sell Bullish Engulfing - The Quant Science🇺🇸
GENERAL OVERVIEW
Buy&Sell Bullish Engulfing - The Quant Science It is a Buy&Sell strategy based on the 'Bullish Engulfing' candlestick pattern. The main goal of the strategy is to achieve a consistent and sustainable return over time, with a manageable level of risk.
Bullish Engulfing
The template was developed at the top of the Indicator provided by TradingView called 'Engulfing - Bullish'.
ENTRY AND EXIT CRITERIA
Entry: A single long order is opened when the candlestick pattern is formed, and the percentage size of the order (%) is fixed by the trader through the user interface.
Exit: The long trade is closed on a percentage equity take profit-stop loss.
----------------------------------------------------------------------------------------------------------------------------------------------------------------------------------------------
🇮🇹
PANORAMICA GENERALE
Buy&Sell Bullish Engulfing - The Quant Science è una strategia Buy&Sell basata sul candlestick pattern 'Bullish Engulfing'. L'obiettivo principale della strategia è ottenere un ritorno costante e sostenibile nel tempo, con un livello gestibile di rischio.
Bullish Engulfing
Il template è stato sviluppato al top dell' Indicatore fornito da Trading View chiamato 'Engulfing - Bullish'.
CRITERI DI ENTRATA E USCITA
Entrata: viene aperto un singolo ordine long quando si forma il candlestick pattern, la size percentuale dell'ordine (%) viene selezionato tramite l'interfaccia utente dal trader.
Uscita: la chiusura della posizione avviene unicamente tramite un take profit-stop loss percentuale calcolato sul capitale.

Volatility Compression Breakout - LeafAlgo Pro StrategyThe Volatility Compression Breakout strategy is designed to identify periods of low volatility followed by potential breakout opportunities in the market. It aims to capture moments when the price consolidates within a narrow range, indicating a decrease in volatility, and anticipates a subsequent expansion in price movement. This strategy is based on our indicator of the same name (), but differs by offering many more options for the band/channel type and trend filters in addition to implementing the ability to use this strategy with algorithmic plug-ins (see details at the bottom).
This strategy features six types of bands/channels and five types of trend filters, for a total of 30 combinations. The six band/channel types are the Adaptive Gaussian MA channel (based on the Adaptive Gaussian MA that we previously published ()), standard Bollinger Bands, smoothed Bollinger Bands (basis is an EMA of the typical Bollinger Basis), Keltner Channels, a Quadratic Regression Channel (based on the channel that we previously published in the LeafAlgo Pro indicator ()), and Volatility-Based Mean Reversion Bands (). The five trend filters include an EMA, SMA, Weighted MA, McGinley Dynamic, and the Adaptive Gaussian MA itself.
Examples of the different band/channel types (all with EMA as the trend filter):
Adaptive Gaussian MA Channel:
Bollinger Bands:
Smoothed Bollinger Bands:
Keltner Channels:
Quadratic Regression Channel:
Volatility-Based Mean Reversion Bands:
Examples of the different trend filters (all with Keltner Channels):
EMA:
SMA:
WMA:
McGinley Dynamic:
Adaptive Gaussian MA:
How the Long/Short Entry Signals are Calculated:
A breakout signal upwards, accompanied by a long entry, is created when the high is greater than the secondary upper band (the upper band plus a standard deviation or with a multiplier, depending on which band/channel type is selected), the latest close is above the trend filter line, and the previous close was below the trend filter line. A break downwards, accompanied by a short entry, is created when the low is below the secondary lower band, the close is below the trend filter line, and the previous close was above the trend filter line. These conditions, along with a confirmed barstate, make up the strategy entry signals.
Coloration:
When the close price is above both the middle/basis and the trend filter, the bars are colored lime green, indicating a potential bullish market sentiment. When the close price is positioned above the basis but below the trend filter, or below the basis but above the trend filter, the bars are colored yellow, signifying a neutral or indecisive market condition. Conversely, when the close price falls below both the basis and the trend filter, the bars are colored fuchsia, suggesting a potential bearish market sentiment. Additionally, the coloration of the middle/basis line and the trend filter provides further visual cues for assessing the trend. When the close price is above the basis, the line is colored lime green, indicating a bullish trend. Conversely, when the close price is below the basis, the line is colored fuchsia, highlighting a bearish trend. Similarly, the trend line is colored lime green when the close price is above it, representing a bullish trend, and fuchsia when the close price is below it, indicating a bearish trend. The fill between the primary and secondary upper bands is colored lime and the fill between the primary and secondary lower bands is colored fuchsia. These colorations can be toggled on/off in the strategy settings menu.
How Changing Parameters Can Be Beneficial:
Modifying the parameters allows you to adapt the indicator to different market conditions and trading styles. For example, with Keltner Channels, increasing the compression period can help identify broader volatility patterns and major market shifts. On the other hand, decreasing the compression period provides more precise and timely signals for short-term traders. Adjusting the compression multiplier affects the width of the Keltner Channels. Higher multipliers increase the breakout threshold, filtering out smaller price movements and providing more reliable signals during significant market shifts. Lower multipliers make the indicator more sensitive to smaller price ranges, generating more frequent but potentially less reliable signals.
Changing the type of trend filter can drastically change your results. Test out each trend filter type and determine which one will work best for your purposes. Further, the MA periods in the trend filter settings can help you align your trades with the prevailing market direction. Increasing the period smoothes out the trend, filtering out shorter-term fluctuations and focusing on more sustained moves. Decreasing the period allows for quicker responses to changes in trend, capturing shorter-term price swings.
By adjusting the parameters and incorporating additional analysis techniques, you can customize the strategy to suit your trading style and preferences. However, it is crucial to exercise caution, conduct thorough analysis, and practice proper risk management to increase the likelihood of successful trades. Remember that no strategy can guarantee profits, and continuous learning and adaptation are key to long-term trading success.
Take Profit/Stop Loss Settings:
Take profit, stop loss, and trailing percentages are also included, found at the bottom of the Input tab under “TT and TTP” as well as “Stop Loss”. The take profit and stop loss levels will be reflected as green and red lines respectively on the chart as they occur. Make sure to understand the TP/SL ratio that you desire before use, as the desired hit rate/profitability percentage will be affected accordingly. The option for adding in a trailing stop has also been included, with options to choose between an ATR-based trail or a percentage-based trail. This strategy does NOT guarantee future returns. Apply caution in trading regardless of discretionary or algorithmic. Understand the concepts of risk/reward and the intricacies of each strategy choice before utilizing them in your personal trading.
Profitview/Pineconnector Settings:
If you wish to utilize Profitview’s automation system, find the included “Profitview Settings” under the Input tab of the strategy settings menu. If not, skip this section entirely as it can be left blank. Options will be “OPEN LONG TITLE”, “OPEN SHORT TITLE”, “CLOSE LONG TITLE”, and “CLOSE SHORT TITLE”. If you wished to trade SOL, for example, you would put “SOL LONG”, “SOL SHORT”, “SOL CLOSE LONG”, and “SOL CLOSE SHORT” in these areas. Within your Profitview extension, ensure that your Alerts all match these titles. To set an alert for use with Profitview, go to the “Alerts” tab in TradingView, then create an alert. Make sure that your desired asset and timeframe are currently displayed on your screen when creating the alert. Under the “Condition” option of the alert, select the strategy, then select the expiration time. If using TradingView Premium, this can be open-ended. Otherwise, select your desired expiration time and date. This can be updated whenever desired to ensure the strategy does not expire. Under “Alert actions”, nothing necessarily needs to be selected unless so desired. Leave the “Alert name” option empty. For the “Message”, delete the generated message and replace it with {{strategy.order.alert_message}} and nothing else. If using Pineconnector, follow the same directions for setting up an alert, but use the ",buy,,risk=" syntax as noted in the tooltips.
Additional Sample Settings (for ETHUSDT-Binance 45M):
Band/Channel Type - Keltner Channels (Compression Period of 20, Multiplier of 1.8x)
Trend Filter - WMA (50 length, no offset, close as the source)
TP/SL - 3.0% TP / 2.0% SL, 0.005 trailed TP, no trailed SL

D-Bot Alpha RSI Breakout StrategyHello dear Traders,
Here is a simple yet effective strategy to use, for best profit higher time frame, such as daily.
Structure of the code
The code defines inputs for SMA (simple moving average) length, RSI (relative strength index) length, RSI entry level, RSI stop loss level, and RSI take profit level. The default values of these variables can be customized as per the user's preferences.
The script calculates SMA and RSI based on the input parameters and the closing price of the asset.
Trading logic
This strategy allows the placement of a long position when:
The RSI crosses above the RSI entry level and
The close price is above the SMA value.
After entering a long position, it applies a trailing stop mechanism. The stop price is updated to the close price if the close price is lower than the last close price.
The script closes the long position when:
RSI falls below the stop loss level.
RSI reaches or exceeds the take profit level.
If the trailing stop is activated (once RSI reaches or exceeds the take profit level), the closing price falls below the trailing stop level.
Strengths
The strategy includes mechanisms for entering a position, taking profit, and stopping losses, which are fundamental aspects of a trading strategy.
It applies a trailing stop mechanism that allows to capture further gains if the price keeps increasing while protecting from losses if the price starts to decrease.
Weaknesses
This strategy only contemplates long positions. Depending on the market situation, the strategy may miss opportunities for short selling when the market is on a downward trend.
The choice of the fixed RSI entry, stop loss, and take profit levels may not be ideal for all market conditions or assets. It might benefit from a more adaptive mechanism that adjusts these levels according to market volatility or trend.
The strategy doesn't factor in trading costs (such as spread or commission), which could have a significant impact on the net profit, especially if the user is trading with a high frequency or in a low liquidity market.
How to trade with this strategy
Given these parameters and the strategy outlined by the code, the trader would enter a long position when the RSI crosses above the RSI entry level (default 34) and the closing price is above the SMA value (SMA calculated with default period of 200). The trader would exit the position when either the RSI falls below the RSI stop loss level (default 30), or RSI rises above the RSI take profit level (default 50), or when the trailing stop is hit.
Remember "The strategies I have prepared are entirely for educational purposes and should not be considered as investment advice. Support your trades using other tools. Wishing everyone profitable trades..."

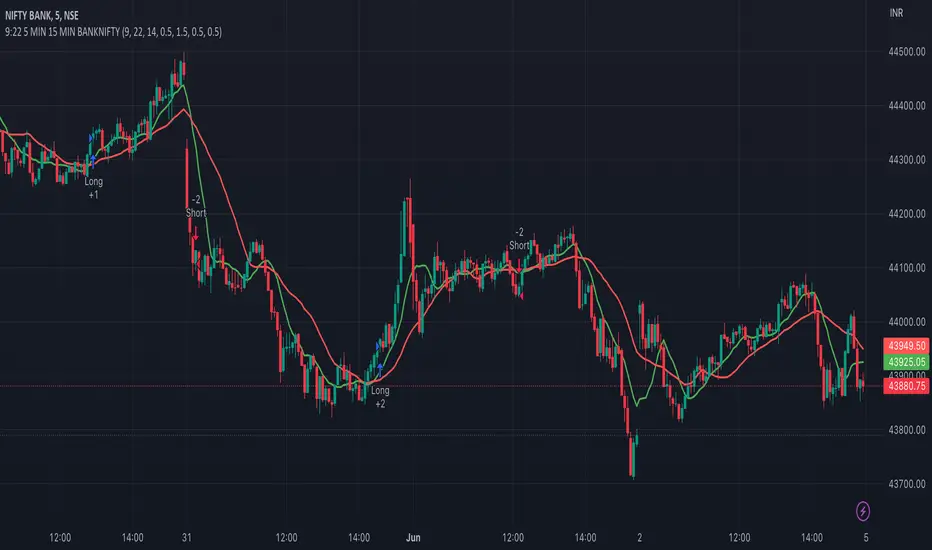
9:22 5 MIN 15 MIN BANKNIFTY9:22 5 MIN 15 MIN BANKNIFTY Strategy with Additional Filters
The 9:22 5 MIN 15 MIN BANKNIFTY Strategy with Additional Filters is a trend-following strategy designed for trading the BANKNIFTY instrument on a 5-minute chart. It aims to capture potential price movements by generating buy and sell signals based on moving average crossovers, breakout confirmations, and additional filters.
Key Features:
Fast MA Length: 9
Slow MA Length: 22
ATR Length: 14
ATR Filter: 0.5
Trailing Stop Percentage: 1.5%
Pullback Threshold: 0.5
Minimum Candle Body Percentage: 0.5
Use Breakout Confirmation: Enabled
Additional Filters:
Volume Threshold: Set a minimum volume requirement for trades.
Trend Filter: Optionally enable a trend filter based on a higher timeframe moving average.
Momentum Filter: Optionally enable a momentum filter using the RSI indicator.
Support/Resistance Filter: Optionally enable a filter based on predefined support and resistance levels.
Buy and Sell Signals:
Buy Signal: A buy signal is generated when the fast moving average crosses above the slow moving average, with additional confirmation from breakout and volume criteria, along with optional trend, momentum, and support/resistance filters.
Sell Signal: A sell signal is generated when the fast moving average crosses below the slow moving average, with similar confirmation and filtering criteria as the buy signal.
Exit Strategy:
The strategy employs a trailing stop-loss mechanism based on a percentage of the average entry price. The stop-loss is dynamically adjusted to protect profits while allowing for potential upside.
Please note that this strategy should be thoroughly backtested and evaluated in different market conditions before applying it to live trading. It is also recommended to adjust the parameters and filters according to individual preferences and risk tolerance.
Feel free to customise and adapt the description as needed to suit your preferences and the specific details of your strategy.
Monthly Strategy Performance TableWhat Is This?
This script code adds a Monthly Strategy Performance Table to your Pine Script strategy scripts so you can see a month-by-month and year-by-year breakdown of your P&L as a percentage of your account balance.
The table is based on realized equity rather than open equity, so it only updates the metrics when a trade is closed.
That's why some numbers will not match the Strategy Tester metrics (such as max drawdown), as the Strategy Tester bases metrics like max drawdown on open trade equity and not realized equity (closed trades).
The script is still a work-in-progress, so make sure to read the disclaimer below. But I think it's ready to release the code for others to play around with.
How To Use It
The script code includes one of my strategies as an example strategy. You need to replace my strategy code with your own. To do that just copy the source code below into a blank script, delete lines 11 -> 60 and paste your strategy code in there instead of mine. The script should work with most systems, but make sure to read the disclaimer below.
It works best with a significant amount of historical data, so it may not work very effectively on intraday timeframes as there is a severe limitation of available bars on TradingView. I recommend using it on 4HR timeframes and above, as anything less will produce very little usable data. Having a premium TradingView plan will also help boost the number of available bars.
You can hover your mouse over a table cell to get more information in the form of tooltips (such as the Long and Short win rate if you hover over your total return cell).
Credit
The code in this script is based on open-source code originally written by QuantNomad, I've made significant changes and additions to the original script but all credit for the idea and especially the display table code goes to them - I just built on top of it:
Why Did I Make This?
None of this is trading or investment advice, just my personal opinion based on my experience as a trader and systems developer these past 6+ years:
The TradingView Strategy Tester is severely limited in some important ways. And unless you use complex Excel formulas on exported test data, you can't see a granular perspective of your system's historical performance.
There is much more to creating profitable and tradeable systems than developing a strategy with a good win rate and a good return with a reasonable drawdown.
Some additional questions we need to ask ourselves are:
What did the system's worst drawdown look like?
How long did it last?
How often do drawdowns occur, and how quickly are they typically recovered?
How often do we have a break-even or losing month or year?
What is our expected compounded annual growth rate, and how does that growth rate compare to our max drawdown?
And many more questions that are too long to list and take a lifetime of trading experience to answer.
Without answering these kinds of questions, we run the risk of developing systems that look good on paper, but when it comes to live trading, we are uncomfortable or incapable of enduring the system's granular characteristics.
This Monthly Performance Table script code is intended to help bridge some of that gap with the Strategy Tester's limited default performance data.
Disclaimer
I've done my best to ensure the numbers this code outputs are accurate, and according to my testing with my personal strategy scripts it appears to work fine. But there is always a good chance I've missed something, or that this code will not work with your particular system.
The majority of my TradingView systems are extremely simple single-target systems that operate on a closed-candle basis to minimize many of the data reliability issues with the Strategy Tester, so I was unable to do much testing with multiple targets and pyramiding etc.
I've included a Debug option in the script that will display important data and information on a label each time a trade is closed. I recommend using the Debug option to confirm that the numbers you see in the table are accurate and match what your strategy is actually doing.
Always do your own due diligence, verify all claims as best you can, and never take anyone's word for anything.
Take care, and best of luck with your trading :)
Kind regards,
Matt.
PS. If you're interested in learning how this script works, I have a free hour-long video lesson breaking down the source code - just check out the links below this script or in my profile.

Hobbiecode - Five Day Low RSI StrategyThis is a simple strategy that is working well on SPY but also well performing on Mini Futures SP500. The strategy is composed by the followin rules:
1. If today’s close is below yesterday’s five-day low, go long at the close.
2. Sell at the close when the two-day RSI closes above 50.
3. There is a time stop of five days if the sell criterium is not triggered.
If you backtest it on Mini Futures SP500 you will be able to track data from 1993. It is important to select D1 as timeframe.
Please share any comment or idea below.
Have a good trading,
Ramón.

SuperTrend Long Strategy +TrendFilterThis strategy aims to identify long (buy) opportunities in the market using the SuperTrend indicator. It utilizes the Average True Range (ATR) and a multiplier to determine the dynamic support levels for entering long positions. This presentation will provide an overview of the strategy's components, explain its usage, and highlight that it focuses on long trades.
Components of the Strategy:
1. ATR Period: This input determines the period used for calculating the Average True Range (ATR). A higher value may result in smoother trend lines but may lag behind recent price changes.
2. Source (src): This input determines the price source used for calculations, with "hl2" (the average of high and low prices) set as the default.
3. ATR Multiplier: This input specifies the multiplier applied to the ATR value to determine the distance of the support levels from the source.
4. Change ATR Calculation Method: This input allows toggling between two methods of ATR calculation: the default method using atr() or a simple moving average (SMA) of ATR values (sma(tr, Periods)).
5. Show Buy/Sell Signals: This input enables or disables the display of buy and sell signals on the chart.
6. Highlighter On/Off: This input controls whether highlighting of up and down trends is displayed on the chart.
7. Bar Coloring On/Off: This input determines whether the bars on the chart are colored based on the trend direction.
8. The "SuperTrend Long STRATEGY" has been enhanced by incorporating a trend filter. A moving average is used as the filter to confirm the prevailing trend before executing trades. This addition effectively reduces false signals and improves the strategy's reliability, all while maintaining its original name.
Strategy Logic:
1. The strategy calculates the upper (up) and lower (dn) trend lines based on the ATR value and the chosen multiplier.
2. The trend variable keeps track of the current trend, with 1 indicating an uptrend and -1 indicating a downtrend.
3. Buy and sell signals are generated based on the change in trend direction.
4. The strategy includes an optional highlighting feature that colors the chart background based on the current trend.
5. Additionally, the bar coloring feature colors the bars based on the direction of the last trend change.
Usage:
1. ATR Period and ATR Multiplier can be adjusted based on the desired sensitivity and risk tolerance.
2. Buy and sell signals can be displayed using the Show Buy/Sell Signals input, providing clear indications of entry and exit points.
3. The Highlighter On/Off input allows users to visually identify the prevailing trend by coloring the chart background.
4. The Bar Coloring On/Off input offers a quick visual reference for the most recent trend change.
Long Strategy:
The SuperTrend Long Strategy is specifically designed to identify long (buy) opportunities. It generates buy signals when the current trend changes from a downtrend to an uptrend, indicating a potential entry point for long positions. The strategy aims to capture upward price movements and maximize profits during bullish market conditions.
The SuperTrend Long Strategy provides traders with a systematic approach to identifying long trade opportunities. By leveraging the SuperTrend indicator and dynamic support levels, this strategy aims to generate buy signals in uptrending markets. Traders can customize the inputs and utilize the visual features to adapt the strategy to their specific trading preferences.
The modification adds a trend filter to the "SuperTrend Long STRATEGY" to improve its effectiveness. The trend filter uses a moving average to confirm the prevailing trend before taking trades. This addition helps filter out false signals and enhances the strategy's reliability without changing its name.

Slight Swing Momentum Strategy.Introduction:
The Swing Momentum Strategy is a quantitative trading strategy designed to capture mid-term opportunities in the financial markets by combining swing trading principles with momentum indicators. It utilizes a combination of technical indicators, including moving averages, crossover signals, and volume analysis, to generate buy and sell signals. The strategy aims to identify market trends and capitalize on price momentum for profit generation.
Highlights:
The strategy offers several key highlights that make it unique and potentially attractive to traders:
Swing Trading with Momentum: The strategy combines the principles of swing trading, which aim to capture short-to-medium-term price swings, with momentum indicators that help identify strong price trends and potential breakout opportunities.
Technical Indicator Optimization: The strategy utilizes a selection of optimized technical indicators, including moving averages and crossover signals, to filter out the noise and focus on high-probability trading setups. This optimization enhances the strategy's ability to identify favourable entry and exit points.
Risk Management: The strategy incorporates risk management techniques, such as position sizing based on equity and dynamic stop loss levels, to manage risk exposure and protect capital. This helps to minimize drawdowns and preserve profits.
Buy Condition:
The buy condition in the strategy is determined by a combination of factors, including A1, A2, A3, XG, and weeklySlope. Let's break it down:
A1 Condition: The A1 condition checks for specific price relationships. It verifies that the ratio of the highest price to the closing price is less than 1.03, the ratio of the opening price to the lowest price is less than 1.03, and the ratio of the highest price to the previous day's closing price is greater than 1.06. This condition looks for a specific pattern indicating potential bullish momentum.
A2 Condition: The A2 condition checks for price relationships related to the closing price. It verifies that the ratio of the closing price to the opening price is greater than 1.05 or that the ratio of the closing price to the previous day's closing price is greater than 1.05. This condition looks for signs of upward price movement and momentum.
A3 Condition: The A3 condition focuses on volume. It checks if the current volume crosses above the highest volume over the last 60 periods. This condition aims to identify increased buying interest and potentially confirms the strength of the potential upward price movement.
XG Condition: The XG condition combines the A1 and A2 conditions and checks if they are true for both the current and previous bars. It also verifies that the ratio of the closing price to the 5-period EMA crosses above the 9-period SMA of the same ratio. This condition helps identify potential buy signals when multiple factors align, indicating a strong bullish momentum and potential entry point.
Weekly Trend Factor: The weekly slope condition calculates the slope of the 50-period SMA over a weekly timeframe. It checks if the slope is positive, indicating an overall upward trend on a weekly basis. This condition provides additional confirmation that the stock is in an upward trend.
When all of these conditions align, the buy condition is triggered, indicating a favourable time to enter a long position.
Sell Condition:
The sell condition is relatively straightforward in the strategy:
Sell Signal: The sell condition simply checks if the closing price crosses below the 10-period EMA. When this condition is met, it indicates a potential reversal or weakening of the upward price momentum, and a sell signal is generated.
Backtest Outcome:
The strategy was backtested over the period from January 22nd, 1999 to May 3rd, 2023, using daily candlestick charts for the NASDAQ: NVDA. The strategy used an initial capital of 1,000,000 USD, The order quantity is defined as 10% of the equity. The strategy allows for pyramiding with 1 order, and the transaction fee is set at 0.03% per trade. Here are the key outcomes of the backtest:
Net Profit: 539,595.84 USD, representing a return of 53.96%.
Percent Profitable: 48.82%
Total Closed Trades: 127
Profit Factor: 2.331
Max Drawdown: 68,422.70 USD
Average Trade: 4,248.79 USD
Average Number of Bars in Trades: 11, indicating the average duration of the trades.
Conclusion:
In conclusion, the Swing Momentum Strategy is a quantitative trading approach that combines swing trading principles with momentum indicators to identify and capture mid term trading opportunities. The strategy has demonstrated promising results during backtesting, including a significant net profit and a favourable profit factor.

Dynamic Stop Loss DemoWhat does this script do ?
This script is for pine script programmers and explains how to implement a dynamic stop-loss strategy. It is different from trailing stop-loss. Trailing stop-loss can only set the retracement value, but this script can take profit on part of the position at a fixed price and allows users to decide whether to take profit on all positions based on whether a certain track is breached or other conditions author want. In this demo, it use rsi crossover and crossunder to decide the strategy condition, and use close price as open price, and use lowest low / highest high as stop price, and use 1.5 risk ratio to calculate the fixed first profit price. It will take 50% position size when the first profit price was reached. Then it will close all rest positions when the inverse condition come out or the dynamic stop(calculated by ATR) breached or when the price back to the open price or the stop price.
How is this script implemented
When start strategy by strategy.entry , it gives a custom id which contains direction, openPrice, stopPrice, profitPrice, qty, etc. It can be get from the global variable strategy.posiition_entry_name .

Optimized Zhaocaijinbao strategyIntroduction:
The Optimized Zhaocaijinbao strategy is a mid and long-term quantitative trading strategy that combines momentum and trend factors. It generates buy and sell signals by using a combination of exponential moving averages, moving averages, volume and slope indicators. It generates buy signals when the stock is above the 35-day moving average, the trading volume is higher than the 20-day moving average, and the stock is in an upward trend on a weekly timeframe."招财进宝" is a Chinese phrase that can be translated to "Attract Wealth and Bring in Treasure" in English. It is a common expression used to wish for good luck and prosperity in various contexts, such as in business or personal finances.
Highlights:
The strategy has several special optimizations that make it unique.
Firstly, the strategy is optimized for T+1 trading in the Chinese stock market and is only suitable for long positions. The optimizations are also applicable to international stock markets.
Secondly, the trend strategy is optimized to only show indicators on the right side and oscillations. This helps to prevent false signals in choppy markets.
Thirdly, the strategy uses a risk factor for dynamic position sizing to ensure position sizes are adjusted according to the current net asset value and risk preferences. This helps to lower drawdown risks.
The strategy has good resilience even without using stop loss modules in backtesting, making it suitable for trading hourly, 2-hourly, and daily K-line charts (depending on the stock being traded). We recommend experimenting with backtesting using SSE 1-hour or 2-hour or daily Kline charts.
Backtesting outcomes:
The strategy was backtested over the period from October 13th, 2005 to April 14th, 2023, using daily candlestick charts for the commodity code SSE:600763, with a currency of CNY and tick size of 0.01. The strategy used an initial capital of 1,000,000 CNY, with order sizes set to 10% equity and a pyramid of 1 order. The strategy also had a Max Position Size of 0.01 and a Risk Factor of 2.
Here is a summary of the performance of the trading strategy:
Total net profit: 288,577.32 CNY, representing a return of 128.86%
Total number of closed trades: 61
Winning trades: 37, representing a win rate of 60.66%
Profit factor: 2.415
Largest losing trade: 222,021.46 CNY, representing a loss of 14.08%
Average trade: 21,124.22 CNY, representing a return of 3.1%
Average holding period for all trades: 12 days
Conclusion:
In conclusion, the Optimized Zhaocaijinbao strategy is a mid and long-term quantitative trading strategy that combines momentum and trend factors. It is suitable for both Chinese stocks and global stocks. While the Optimized Zhaocaijinbao strategy has performed well in backtesting, it is important to note that past performance is not a guarantee of future results. Traders should conduct their own research and analysis and exercise caution when using any trading strategy.

Lorentzian Classification Strategy Based in the model of Machine learning: Lorentzian Classification by @jdehorty, you will be able to get into trending moves and get interesting entries in the market with this strategy. I also put some new features for better backtesting results!
Backtesting context: 2022-07-19 to 2023-04-14 of US500 1H by PEPPERSTONE. Commissions: 0.03% for each entry, 0.03% for each exit. Risk per trade: 2.5% of the total account
For this strategy, 3 indicators are used:
Machine learning: Lorentzian Classification by @jdehorty
One Ema of 200 periods for identifying the trend
Supertrend indicator as a filter for some exits
Atr stop loss from Gatherio
Trade conditions:
For longs:
Close price is above 200 Ema
Lorentzian Classification indicates a buying signal
This gives us our long signal. Stop loss will be determined by atr stop loss (white point), break even(blue point) by a risk/reward ratio of 1:1 and take profit of 3:1 where half position will be closed. This will be showed as buy.
The other half will be closed when the model indicates a selling signal or Supertrend indicator gives a bearish signal. This will be showed as cl buy.
For shorts:
Close price is under 200 Ema
Lorentzian Classification indicates a selling signal
This gives us our short signal. Stop loss will be determined by atr stop loss (white point), break even(blue point) by a risk/reward ratio of 1:1 and take profit of 3:1 where half position will be closed. This will be showed as sell.
The other half will be closed when the model indicates a buying signal or Supertrend indicator gives a bullish signal. This will be showed as cl sell.
Risk management
To calculate the amount of the position you will use just a small percent of your initial capital for the strategy and you will use the atr stop loss or last swing for this.
Example: You have 1000 usd and you just want to risk 2,5% of your account, there is a buy signal at price of 4,000 usd. The stop loss price from atr stop loss or last swing is 3,900. You calculate the distance in percent between 4,000 and 3,900. In this case, that distance would be of 2.50%. Then, you calculate your position by this way: (initial or current capital * risk per trade of your account) / (stop loss distance).
Using these values on the formula: (1000*2,5%)/(2,5%) = 1000usd. It means, you have to use 1000 usd for risking 2.5% of your account.
We will use this risk management for applying compound interest.
> In settings, with position amount calculator, you can enter the amount in usd of your account and the amount in percentage for risking per trade of the account. You will see this value in green color in the upper left corner that shows the amount in usd to use for risking the specific percentage of your account.
> You can also choose a fixed amount, so you will have to activate fixed amount in risk management for trades and set the fixed amount for backtesting.
Script functions
Inside of settings, you will find some utilities for display atr stop loss, break evens, positions, signals, indicators, a table of some stats from backtesting, etc.
You will find the settings for risk management at the end of the script if you want to change something or trying new values for other assets for backtesting.
If you want to change the initial capital for backtest the strategy, go to properties, and also enter the commisions of your exchange and slippage for more realistic results.
In risk managment you can find an option called "Use leverage ?", activate this if you want to backtest using leverage, which means that in case of not having enough money for risking the % determined by you of your account using your initial capital, you will use leverage for using the enough amount for risking that % of your acount in a buy position. Otherwise, the amount will be limited by your initial/current capital
I also added a function for backtesting if you had added or withdrawn money frequently:
Adding money: You can choose how often you want to add money (Monthly, yearly, daily or weekly). Then a fixed amount of money and activate or deactivate this function
Withdraw money: You can choose if you want to withdraw a fixed amount or a percentage of earnings. Then you can choose a fixed amount of money, the period of time and activate or deactivate this function. Also, the percentage of earnings if you choosed this option.
Some other assets where strategy has worked
BTCUSD 4H, 1D
ETHUSD 4H, 1D
BNBUSD 4H
SPX 1D
BANKNIFTY 4H, 15 min
Some things to consider
USE UNDER YOUR OWN RISK. PAST RESULTS DO NOT REPRESENT THE FUTURE.
DEPENDING OF % ACCOUNT RISK PER TRADE, YOU COULD REQUIRE LEVERAGE FOR OPEN SOME POSITIONS, SO PLEASE, BE CAREFULL AND USE CORRECTLY THE RISK MANAGEMENT
Do not forget to change commissions and other parameters related with back testing results!. If you have problems loading the script reduce max bars back number in general settings
Strategies for trending markets use to have more looses than wins and it takes a long time to get profits, so do not forget to be patient and consistent !
Please, visit the post from @jdehorty called Machine Learning: Lorentzian Classification for a better understanding of his script!
Any support and boosts will be well received. If you have any question, do not doubt to ask!

Strategy for UT Bot Alerts indicator Using the UT Bot alerts indicator by @QuantNomad, this strategy was designed for showing an example of how this indicator could be used, also, it has the goal to help some people from a group that use to use this indicator for their trading. Under any circumstance I recommend to use it without testing it before in real time.
Backtesting context: 2020-02-05 to 2023-02-25 of BTCUSD 4H by Tvc. Commissions: 0.03% for each entry, 0.03% for each exit. Risk per trade: 2.5% of the total account
For this strategy, 3 indicators are used:
UT Bot Alerts indicator by Quantnomad
One Ema of 200 periods for indicate the trend
Atr stop loss from Gatherio
Trade conditions:
For longs:
Close price is higher than Atr from UT Bot
Ema from UT Bot cross over Atr from UT Bot.
This gives us our long signal. Stop loss will be determined by atr stop loss (white point), break even(blue point) by a risk/reward ratio of 0.75:1 and take profit of 3:1 where half position will be closed. This will be showed as buy (open long position)
The other half will be closed when close price is lower than Atr and Ema from UT Bot cross under Atr. This will be showed as cl buy (close long position)
For shorts:
Close price is lower than Atr from UT Bot
Ema from UT Bot cross over Atr from UT Bot.
This gives us our short signal. Stop loss will be determined by atr stop loss (white point), break even(blue point) by a risk/reward ratio of 0.75:1 and take profit of 3:1 where half position will be closed. This will be showed as sell (open short position)
The other half will be closed when close price is higher than Atr and Ema from UT Bot cross over Atr. This will be showed as cl sell (close short position)
Risk management
For calculate the amount of the position you will use just a small percent of your initial capital for the strategy and you will use the atr stop loss for this.
Example: You have 1000 usd and you just want to risk 2,5% of your account, there is a long signal at price of 20,000 usd. The stop loss price from atr stop loss is 19,000. You calculate the distance in percent between 20,000 and 19,000. In this case, that distance would be of 5,0%. Then, you calculate your position by this way: (initial or current capital * risk per trade of your account) / (stop loss distance).
Using these values on the formula: (1000*2,5%)/(5,0%) = 500usd. It means, you have to use 500 usd for risking 2.5% of your account.
We will use this risk management for apply compound interest.
In settings, with position amount calculator, you can enter the amount in usd of your account and the amount in percentage for risking per trade of the account. You will see this value in green color in the upper left corner that shows the amount in usd to use for risking the specific percentage of your account.
Script functions
Inside of settings, you will find some utilities for display atr stop loss, break evens, positions, signals, indicators, etc.
You will find the settings for risk management at the end of the script if you want to change something. But rebember, do not change values from indicators, the idea is to not over optimize the strategy.
If you want to change the initial capital for backtest the strategy, go to properties, and also enter the commisions of your exchange and slippage for more realistic results.
In risk managment you can find an option called "Use leverage ?", activate this if you want to backtest using leverage, which means that in case of not having enough money for risking the % determined by you of your account using your initial capital, you will use leverage for using the enough amount for risking that % of your acount in a buy position. Otherwise, the amount will be limited by your initial/current capital
---> Do not forget to deactivate Trades on chart option in style settings for a cleaner look of the chart <---
Some things to consider
USE UNDER YOUR OWN RISK. PAST RESULTS DO NOT REPRESENT THE FUTURE.
DEPENDING OF % ACCOUNT RISK PER TRADE, YOU COULD REQUIRE LEVERAGE FOR OPEN SOME POSITIONS, SO PLEASE, BE CAREFULL AND USE CORRECTLY THE RISK MANAGEMENT
Do not forget to change commissions and other parameters related with back testing results!
Strategies for trending markets use to have more looses than wins and it takes a long time to get profits, so do not forget to be patient and consistent !
---> The strategy can still be improved, you can change some parameters depending of the asset and timeframe like risk/reward for taking profits, for break even, also the main parameters of the UT Bot Alerts <----

Double Alligator x Donchian Cloud StrategyThis strategy is based on two sets of Williams Alligator indicators, taking crossovers and crossunders of the two pairs of lips as the main entry signal with confluence from the Donchian Cloud. The first Alligator used is set to the standard 13/8/5 lengths found in the standard indicator. The second Alligator is multiplied tenfold (10x) to 130/80/50 with the offset values also being multiplied. This second set is colored yellow, aqua, and purple for the jaw, teeth, and lips, respectively. A strategy similar to a moving average crossover can be created using these sets of Alligator indicators. While there are 6 lines in total, and can be used for discretionary matters outside of the strategy entry/exits, a cross of the lip pairs seems to yield the most optimal results. As a filter for these signals, we have introduced our Donchian Cloud Score code.
The Donchian Cloud Score is derived from a set of 5 Donchian channels (upper, lower, and basis plotted) defaulted to lengths of 25, 50, 100, 150, and 200. A set of conditions associated with the channels aims to determine ranging versus trending markets. Weights are given to these conditions accordingly, then tallied up to determine the "cloud score", ranging between -25 and 25. In general, a ranging market is determined by a cloud score between -10 and 10, while a positive trending market has a score higher than 10 and a negative trending market has a score lower than -10. That said, long and short thresholds similar to the macro score itself are included in the user settings and set to a default of 3 or -3. Trade frequency will increase the closer these numbers are to zero, however, the stronger (yet infrequent) signals come with values approaching +/- 10 or greater. The cloud score is plotted as a line in the underlay with coloration reflecting ranging or trending markets (green color above the long threshold, gray between the thresholds, and red below the short threshold). The cloud score is incorporated into the strategy syntax for long and short positions in that the score must be above or below the set threshold for a trade to be placed. A breakdown for the Donchian scoring is as follows:
- Broke the 25-length DC (DC(25)) upper band in the previous 3 bars - +1 if true, 0 if false
- Broke the DC(50) upper band in the previous 3 bars - +2 if true, 0 if false
- Broke the DC(100) upper band in the previous 3 bars - +3 if true, 0 if false
- Broke the DC(150) upper band in the previous 3 bars - +4 if true, 0 if false
- Broke the DC(200) upper band in the previous 3 bars - +5 if true, 0 if false
- Broke the DC(25) lower band in the previous 3 bars - -1 if true, 0 if false
- Broke the DC(50) lower band in the previous 3 bars - -2 if true, 0 if false
- Broke the DC(100) lower band in the previous 3 bars - -3 if true, 0 if false
- Broke the DC(150) lower band in the previous 3 bars - -4 if true, 0 if false
- Broke the DC(200) lower band in the previous 3 bars - -5 if true, 0 if false
- DC(25) basis line above the DC(50) basis line - +1 if true, -1 if false
- DC(25) basis line above the DC(100) basis line - +1 if true, -1 if false
- DC(25)basis line above the DC(150) basis line - +1 if true, -1 if false
- DC(25) basis line above the DC(200) basis line - +1 if true, -1 if false
- DC(50) basis line above the DC(100) basis line - +1 if true, -1 if false
- DC(50) basis line above the DC(150) basis line - +1 if true, -1 if false
- DC(50) basis line above the DC(200) basis line - +1 if true, -1 if false
- DC(100) basis line above the DC(150) basis line - +1 if true, -1 if false
- DC(100) basis line above the DC(200) basis line - +1 if true, -1 if false
- DC(150) basis line above the DC(200) basis line - +1 if true, -1 if false
Take profit, stop loss, and trailing percentages are also included, found at the bottom of the Input tab under “TT and TTP” as well as “Stop Loss”. Make sure to understand the TP/SL ratio that you desire before use, as the desired hit rate/profitability percentage will be affected accordingly. The option for adding in a trailing stop has also been included, with options to choose between an ATR-based trail or a percentage-based trail. This strategy does NOT guarantee future returns. Apply caution in trading regardless of discretionary or algorithmic. Understand the concepts of risk/reward and the intricacies of each strategy choice before utilizing them in your personal trading.
Profitview/Pineconnector Settings:
If you wish to utilize Profitview’s automation system, find the included “Profitview Settings” under the Input tab of the strategy settings menu. If not, skip this section entirely as it can be left blank. Options will be “OPEN LONG TITLE”, “OPEN SHORT TITLE”, “CLOSE LONG TITLE”, and “CLOSE SHORT TITLE”. If you wished to trade SOL, for example, you would put “SOL LONG”, “SOL SHORT”, “SOL CLOSE LONG”, and “SOL CLOSE SHORT” in these areas. Within your Profitview extension, ensure that your Alerts all match these titles. To set an alert for use with Profitview, go to the “Alerts” tab in TradingView, then create an alert. Make sure that your desired asset and timeframe are currently displayed on your screen when creating the alert. Under the “Condition” option of the alert, select the strategy, then select the expiration time. If using TradingView Premium, this can be open-ended. Otherwise, select your desired expiration time and date. This can be updated whenever desired to ensure the strategy does not expire. Under “Alert actions”, nothing necessarily needs to be selected unless so desired. Leave the “Alert name” option empty. For the “Message”, delete the generated message and replace it with {{strategy.order.alert_message}} and nothing else. If using Pineconnector, follow the same directions for setting up an alert, but use the ",buy,,risk=" syntax as noted in the tooltips.
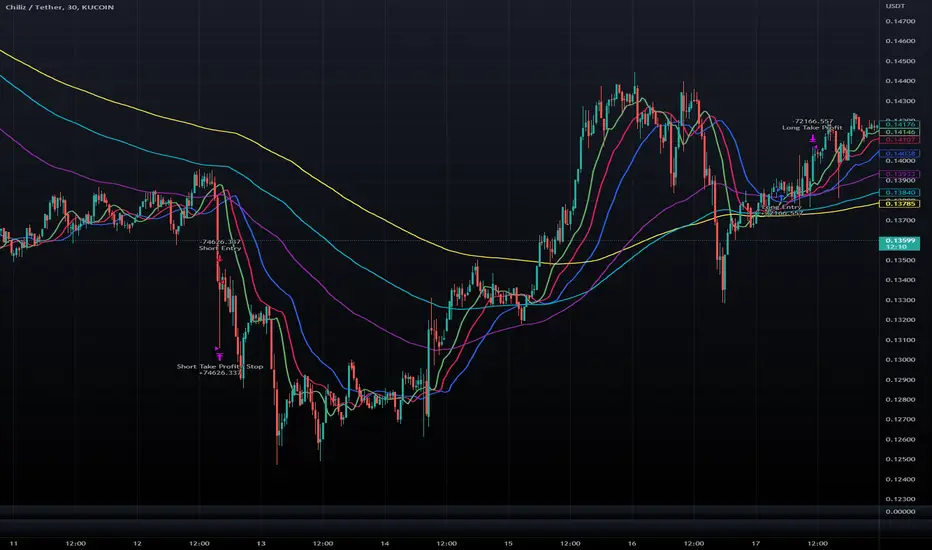
Athena Momentum Squeeze - Short, Lean, and Mean This is a very profitable strategy focusing on 15 minute intervals on the Micro Nasdaq Futures contracts. CME_MINI:MNQH2023
As this contract only keeps positions for on average about an hour risk is managed. At a profit factor of 3.382 with a max drawdown of $123 from January 1st to February 15. Looking back to Dec 2019 still maintains a profit factor of 1.3.
See backtesting: www.screencast.com
2019 backtesting: www.screencast.com
Based on the classic Lazy Bear Oscillator Squeeze with a number of modifications from ADX, MAs and adding fibonacci levels.
We like keeping strategies simple yet powerful, no completely where you can't understand your own trades.
Our team is always modifying and improving the strategy. Always open to collaborating on improving as there is no perfect strategy. www.screencast.com

Token Metrics IndicatorThe Token Metrics Combined Indicator v2 is a comprehensive technical analysis tool designed to output Long/Short signals for crypto assets on TradingView. It combines multiple indicators, including Token Metrics Clouds, Token Metrics Trend Lines , Token Metrics Channels, and signals, to give a comprehensive outlook on the market trend and potential entry/exit points.
Users can backtest the signals to understand the strategy's historical performance, learn how to use it, identify its pros and cons, and determine the market conditions it best suits. It is important to note that the backtesting performance does not indicate future results.
The methods for calculating fixed stop-losses vary depending on the trading pattern. A fixed stop-loss is used for long-term trading, while a trading stop-loss is used for high-frequency trading. This provides flexible investment risk management, allowing you to assign different stop-loss percentages to different trading strategies.
The Length input allows users to control the indicator’s sensitivity, with a default value of 20 bars for long-term trading and 9 bars for high-frequency trading. The Adjustment Factor input has a default value of 0.1 and can be adjusted to adapt to changing levels of volatility . The Stop-loss input allows users to control their risk tolerance, with a default value of 8% for long-term trading and 2% for high-frequency trading.
Token Metrics Clouds incorporates a bullish / bearish trend indicator, which uses two adaptive moving averages that adapt to volatility , reducing false trend signals during range-bound environments and providing a more accurate representation of market trends.
The Token Metrics Trendline is a long-term indicator that uses an adaptive moving average to identify long-term trends. This can also be used for long-term resistance and support levels, providing a comprehensive overview of the current market situation for both long-term and high-frequency traders.
The Token Metrics Signals indicator provides long, short, and close signals, indicating when to enter and exit long or short positions based on the TM trend-following strategy.
The Token Metrics Channels indicator is a top/bottom indicator that adjusts to current levels of volatility . This uses adaptive Donchian channels to determine the previous short-term swing high and low, providing insight into where short-term resistance or support might be forming and where breakouts can occur. The look-back periods change according to the strategy time frame, offering a flexible and dynamic approach to market analysis.
Long-term trading is a trend-following strategy best suited for daily and weekly timeframes. This strategy works well in trending markets but may produce false signals in choppy or range-bound markets.
High-frequency trading is a mean-reverting strategy best suited for 15-minute, 30-minute, and 1-hour timeframes. This strategy performs well in choppy or range-bound markets but may not be effective in strong trending markets.
